Guest Post: Understanding High School Profiles: What Every College Applicant Should Know
By Steve Tapper, Independent College Counselor
High schools have a variety of grading scales, grade distributions, average ACT/SAT scores, and availability of Advanced Placement (AP) or International Baccalaureate (IB) courses. To provide colleges with context for college admissions officers to understand a student’s academic experience, high schools send colleges a high school profile. In this blog post, we’ll explore the key differences in high schools that influence how colleges evaluate students.
Grading Scales
One significant variation between high schools is their grading scale. Many operate on a traditional 4.0 scale, where an A is a 4.0, a B is a 3.0, and so on. However, other schools use more nuanced systems:
- Some use a 100-point grading system. Most consider anything 90 and above an A (or an A- for a 90-92 if they use plusses and minuses), while others set a more stringent standard, requiring a 93 or higher to earn an A, so a 91 or 92 would be a B.
- The majority of high schools, like Maple Grove (MN) Senior High, provide a weighted GPA by adding points to AP or IB classes. Some also add points for dual enrollment and/or honors classes.
- Occasionally, schools like those in the Atlanta Public Schools only list weighted grades on the transcript and add 10 points (on a 100-point scale) for AP, IB, or core dual enrollment courses. Seeing only weighted grades might give students a false sense of how strong their grades are. Colleges differentiate between weighted and unweighted grades, and those that recalculate GPA will remove the weighting these high schools add. Thus, what initially may appear to be a B in an AP or IB class is actually a C.
Grade Distribution: Is There Inflation or Deflation?
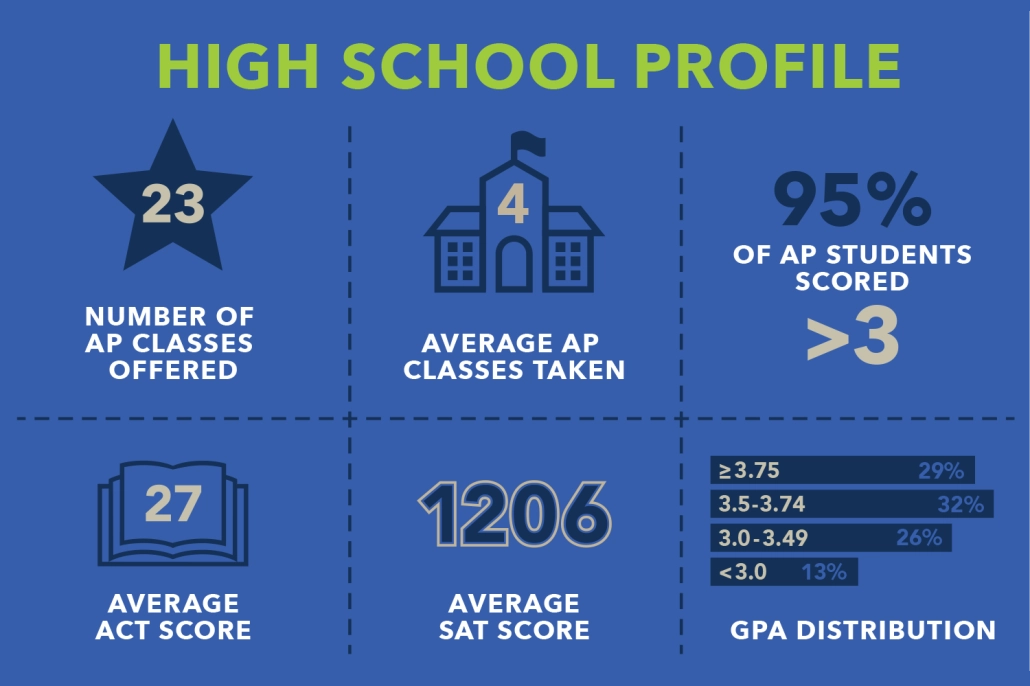
An increasing number of high schools have grade inflation, making it difficult for colleges to distinguish between students at the top of the class—especially since most schools no longer rank students. A small percentage of schools, like Atlanta Classical Academy (ACA), are transparent and show what percentage of students fall within specific GPA ranges. With only half the students at or above a 3.5 GPA, getting an A at ACA is challenging.
AP and IB Offerings
When reviewing a transcript, colleges will look at which AP courses a student took compared to what was available. Glenbrook North High School in suburban Chicago offers 23 AP classes. Other schools may only have a few APs. If many APs are available, which ones you take matters, as AP classes have varying degrees of rigor; for example, AP Environmental Science is not viewed as rigorous as AP Biology or AP Chemistry. A growing number of schools participate in the IB Diploma Programme (IBDP). In an IBDP, which subjects you take that are Higher Level (HL) vs. Standard Level (SL) can matter. Some high schools, such as Phillips Exeter Academy, don’t have AP or IB classes and have their own system of categorizing the rigor of their classes.
SAT and ACT Score Averages
SAT and ACT scores can vary significantly among high schools. Getting a 27 on the ACT might be one of the top scores at an under-resourced school yet below average at others, like the University School of Nashville (median ACT of 30+). Colleges may view test scores in the context of the high school, so simply looking at a college’s middle 50% test score range for admitted students may not tell the whole story. Some test-optional colleges, though, are clear that you should not submit an ACT or SAT score below the institution’s middle 50% range, regardless of school context.
Conclusion
When evaluating your high school transcript and application as a whole, colleges consider much more than just your GPA. They look closely at the high school profile—which will show the school’s grading scale, availability of advanced coursework, ACT/SAT averages, and overall resources—and how your curriculum rigor, grades, and test scores fit within your school’s broader context.
Steve Tapper is an independent college counselor at Tapper College Counseling and can be reached at [email protected]. He is a member of IECA, HECA, and SACAC and earned a certificate in College Counseling with Distinction from UCLA.