Understanding the New SAT’s 1600-point score scale
Note: This blog post was originally published June 12, 2016, but was heavily heavily augmented with additional data when the College Board released full percentile data for the new test on 6/24/16.
Since the May SAT scores came out earlier this month, we wanted to write a detailed blog post that can help address students’ and parents’ questions about their May scores: “so what does this actually mean?”
Let’s start off by mentioning innocent mistakes #1 and #2:
1. Parents and students should not attempt to create a new 1600-point score by multiplying the old 2400-point score by 2/3; it will provide a very inaccurate score conversion due to the shape of the curve, the lack of the essay impacting the New SAT score, and a multitude of other statistical reasons.
2. Parents should never make comparisons between the Old SAT score out of 1600 and the New SAT Score out of 1600. While they are both out of 1600 the curves are very, very different.
Big changes to the New SAT score scale, the shape of its curve, and how score percentiles are reported:
1. The Old SAT had 5 answer choices. The New SAT has only 4 answer choices.
2. The Old SAT took off points for incorrect answers. The New SAT has no such guessing penalty. Thus, students who now randomly guess (A) do not lose points and (B) have a 1/4 chance instead of a 1/5 chance of randomly getting it correct on top of that! As a result, the SAT curve is no longer shaped like a broadly-shaped gumdrop but more like a witch’s hat that is more heavily concentrated on the right side of the spectrum.
3. The Old SAT had an average of 500 on each section. With fewer answer choices and no wrong answer penalty, the average New SAT score zoomed from 998 all the way to 1084 (an entire standard deviation!). The National Merit Commended cutoff score has also dramatically jumped from a long-standing score of 200-203 all the way to 209.
4. Under the New SAT, a robot who just randomly guesses now earns a score that is hundreds of points higher than it would have earned by randomly guessing on the Old SAT. Virtually half of the entire “New SAT” 1600-point score spectrum is below the score a robot would earn by randomly guessing. Getting 25% of the questions right (guessing) earns you a score of 780 out of 1600 on Official New SAT Practice Test #4.
5. On the New SAT, the true college-bound score spectrum (starting 6-7 questions below the average and ending at the point where < 1 student per room hits that score) is not 1600 points, but just 380 points (from 1030-1410). The vast majority of college applicants will be playing in a tiny range of 370 points, not 1600 points. While the 1400-1600 range seems very broad, it represents just 6% of test-takers. On average, less than one student per test site will hit a 1520+.
6. In a bizarre twist, these changes actually make practicing for the SAT even more important. Because students may have good days/bad days from test to test and because of the new hyper-compressed score spectrum of just 380 points, we now live in a world in which each additional question is usually worth 7-8 points and in which Stanford’s SAT average will likely only be 100 or so points above UGA’s Early Action average. As much as students used to stress over 40 points on the Old SAT, 40 points on the Old SAT were rarely the sole reason for a college’s denial. On the New SAT, however, 40 points will likely be the size of the score gap between UGA’s Early Action average and Georgia Tech’s average!
7. Dueling percentiles: Parents will notice that new score reports have two sets of percentiles: “Nationally Representative Sample Percentile” and “User Percentile.”
Here’s a sample:
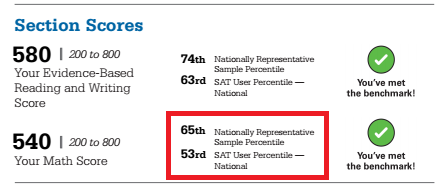
”Nationally Representative Sample” — Do not use this number in any way when analyzing your student’s scores. These are made-up percentiles that attempt to estimate what percentile your student would be if, in theory, every high school student in the whole U.S. were forced to take the test, including those who do not take the test / might drop out / will not go to college. It’s fake unicorn data that makes everyone look better than reality. The average score for this pool of test takers is a 1019 out of 1600.
7. This blog post is written to emphasize to parents that while the New SAT scale is out of 1600, the “actual college bound student score range” is really only about a quarter of that range. Preparing for the tests (whether ACT or New SAT) remains as important as ever.
8. The above changes may make many parents question if their students should just take the ACT instead. The answer is “maybe.” Students should always take a full-length, real mock test of both the New SAT and the ACT and pursue whichever test they perform more strongly on. The downside to the ACT remains the fact that a substantial portion of America cannot hope to finish the test; for students who can’t finish dozens of questions on the ACT, the SAT tends to come out as the stronger score when the student takes diagnostic mock tests. For students who finish the ACT without any problem, the ACT is often the stronger score. A full list of our upcoming diagnostic mock tests is always located at this link.
For those of you who are more visually-inclined, we created two very helpful side-by-side comparison graphics for Old SAT vs. New SAT with commentary in the last column!
Table #1: The New SAT Percentiles:
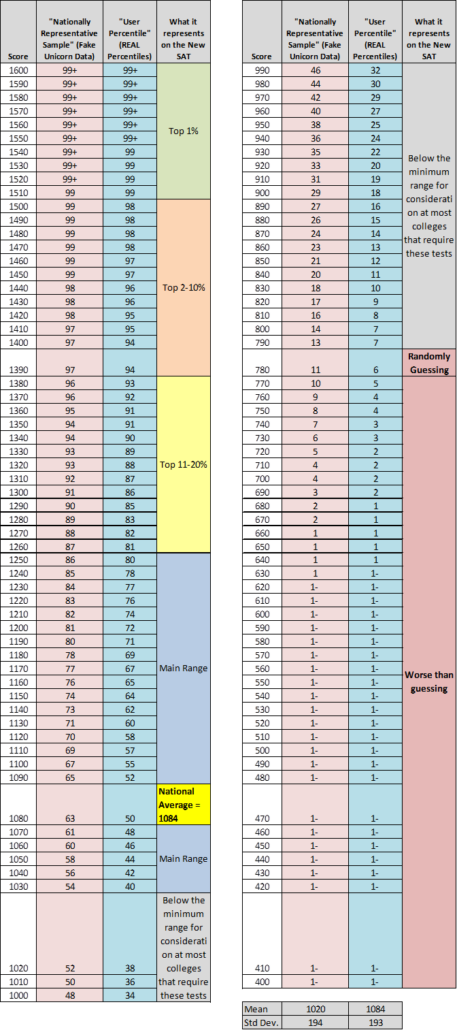
Note: Since a normal bell curve would have 3 standard deviations on both side, this illustrates how heavily tilted to the right the curve is. (1084 avg + 193 *3 std dev = 1663, which is far above the max score of 1600.)
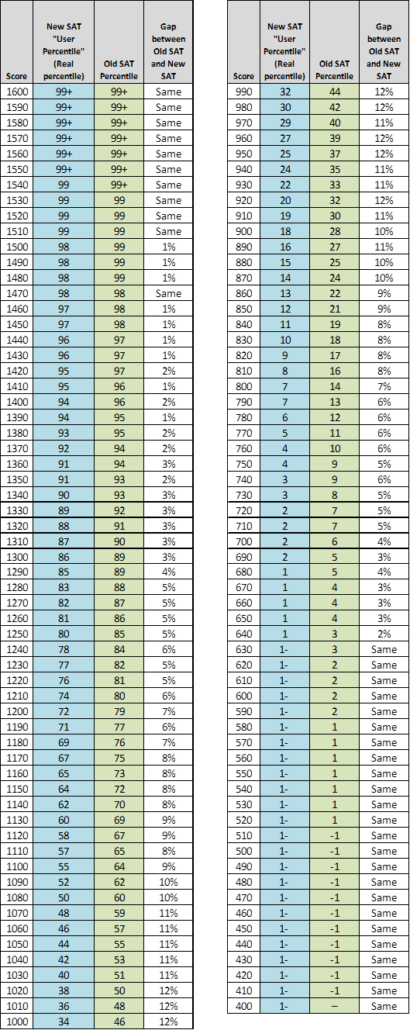
Table #2: Comparing Percentiles for the New SAT and Old SAT:
Please call us at 404-333-8573 or email us at [email protected]. Thanks!Sources and Notes:
4. The ACT has come out and said that they do not endorse this grid, but since the ACT hasn’t put out anything of its own and since seniors are applying to college soon, in absence of anything from the ACT, this is likely the exact spreadsheet colleges will all be using.